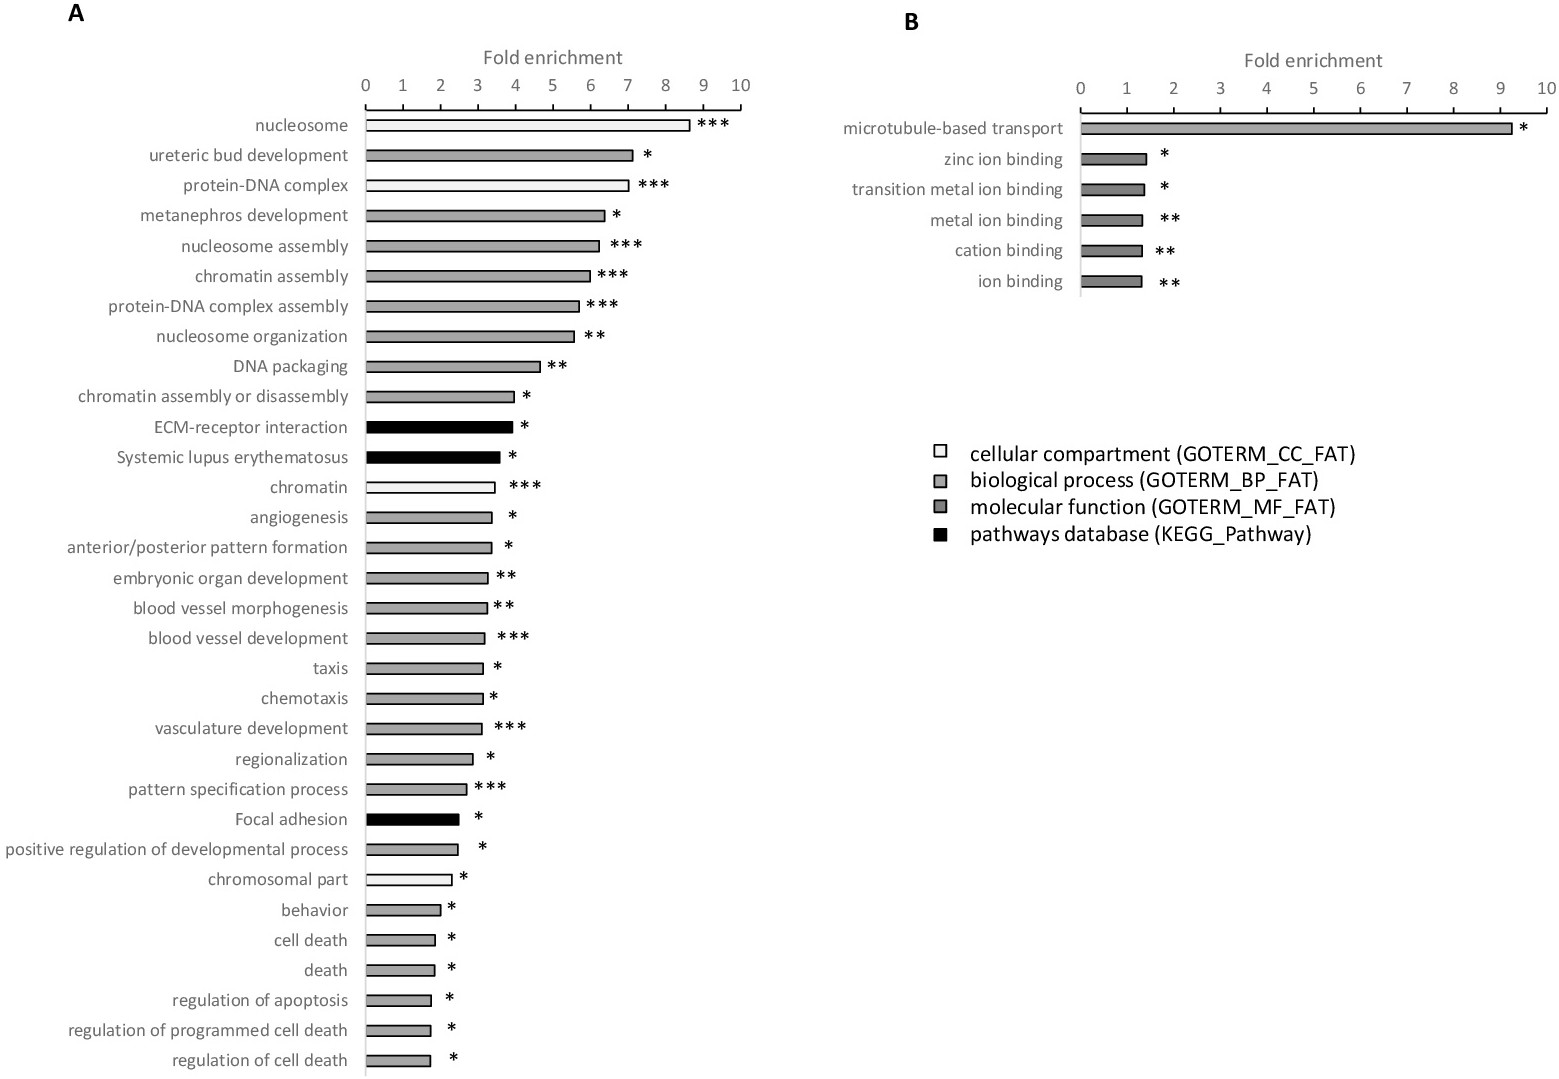
Fig. 6. Gene enrichment analysis. Gene ontology analysis in DAVID using the genes from tables S2 (A) and S3 (B) with at least 1.5-fold expression difference between DZNep-treated and untreated cells. *: p-value < 0.05; **: p-value < 0.01; ***: p-value < 0,001.